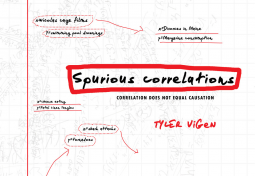
Spurious Correlations
This title was previously available on NetGalley and is now archived.
Send NetGalley books directly to your Kindle or Kindle app
1
To read on a Kindle or Kindle app, please add kindle@netgalley.com as an approved email address to receive files in your Amazon account. Click here for step-by-step instructions.
2
Also find your Kindle email address within your Amazon account, and enter it here.
Pub Date May 12 2015 | Archive Date Jun 1 2015
Description
Is there a correlation between Nic Cage films and swimming pool accidents? What about beef consumption and people getting struck by lightning? Absolutely not. But that hasn't stopped millions of people from going to tylervigen.com and asking, "Wait, what?" Vigen has designed software that scours enormous data sets to find unlikely statistical correlations. He began pulling the funniest ones for his website and has since gained millions of views, hundreds of thousands of likes, and tons of media coverage. Subversive and clever, Spurious Correlations is geek humor at its finest, nailing our obsession with data and conspiracy theory.
Available Editions
| EDITION | Hardcover |
| ISBN | 9780316339438 |
| PRICE | $20.00 (USD) |
Average rating from 2 members
Featured Reviews
 David W, Media/Journalist
We drown in data. Supposed trends assault us daily. Idiotic predictions are based on current data only. Who puts all this data together to get these conclusions? Tyler Vigen has asked a computer to pair charts by how similar the curves were. Relevance was irrelevant. The results make little sense, but point to how laughable the data we live by can be. My fave: there is a 99.3% correlation between alcohol purchased in liquor stores and the number of bridges in the United States. Hmmm, I hear you say. What can we make of this?
Which is precisely Vigen’s point.
The book is largely white space. One page has the titles of the two data streams, and the other has the actual chart of them, with a sidebar of some trivia associated with one of the streams, showing he actually did some research. Maybe. Very cute, very enjoyable, and very telling.
David Wineberg
Readers who liked this book also liked:

George Loewenstein
Business, Leadership, Finance, Health, Mind & Body, Nonfiction (Adult)

Views expressed in promotions/advertisements do not necessarily reflect those of NetGalley or its affiliates.
© 2026 NetGalley LLC
• All Rights Reserved


Views expressed in promotions/advertisements do not necessarily reflect those of NetGalley or its affiliates.