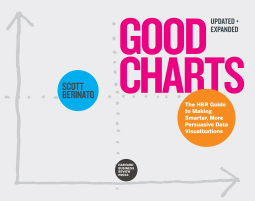
Good Charts, Updated and Expanded
The HBR Guide to Making Smarter, More Persuasive Data Visualizations
by Scott Berinato
This title was previously available on NetGalley and is now archived.
Send NetGalley books directly to your Kindle or Kindle app
1
To read on a Kindle or Kindle app, please add kindle@netgalley.com as an approved email address to receive files in your Amazon account. Click here for step-by-step instructions.
2
Also find your Kindle email address within your Amazon account, and enter it here.
Pub Date Aug 29 2023 | Archive Date Aug 29 2023
Talking about this book? Use #GoodChartsUpdatedandExpanded #NetGalley. More hashtag tips!
Description
The ultimate guide to data visualization and information design for business.
Making good charts is a must-have skill for managers today. The vast amount of data that drives business isn't useful if you can't communicate the valuable ideas contained in that data—the threats, the opportunities, the hidden trends, the future possibilities.
But many think that data visualization is too difficult—a specialist skill that's either the province of data scientists and complex software packages or the domain of professional designers and their visual creativity.
Not so. Anyone can learn to produce quality "dataviz" and, more broadly, clear and effective information design. Good Charts will show you how to do it.
In this updated and expanded edition, dataviz expert Scott Berinato provides all you need for turning those ordinary charts kicked out of a spreadsheet program into extraordinary visuals that captivate and persuade your audience and for transforming presentations that seem like a mishmash of charts and bullet points into clear, effective, persuasive storytelling experiences.
Good Charts shows how anyone who invests a little time getting better at visual communication can create an outsized impact—both in their career and in their organization. You will learn:
- A framework for getting to better charts in just a few minutes
- Design techniques that immediately make your visuals clearer and more persuasive
- The building blocks of storytelling with your data
- How to build teams to bring visual communication skills into your organization and culture
This new edition of Good Charts not only provides new visuals and updated concepts but adds an entirely new chapter on building teams around the visualization part of a data science operation and creating workflows to integrate visualization into everything you do.
Graphics that merely present information won't cut it anymore. Make Good Charts your go-to resource for turning plain, uninspiring charts and presentations into smart, effective visualizations and stories that powerfully convey ideas.
Available Editions
| EDITION | Other Format |
| ISBN | 9781647825133 |
| PRICE | $35.00 (USD) |
| PAGES | 272 |


